Question
Average number of NABARD courses sold on Friday and Saturday together were how much more than average number of RBI courses sold on Thursday and Friday together?
Answer the questions based on the information given below. The line graph given below shows the number of RBI courses and number of NABARD courses, sold by an Edtech company, during 6 different days. Read the graph carefully and answer the questions that follow.
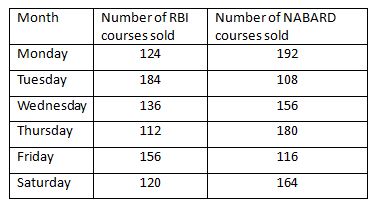 Required difference = {(116 + 164) ÷ 2} - {(112 + 156) ÷ 2} = 140 - 134 = 6
More DI Questions
- If 60% of total employees in department B in 2016 are male and 40% of total employees in department A in 2018 are female, then find the ratio of total numb...
- What is the difference between average of students who apply for Graduation over all years and average of students who apply for Post Graduation over all y...
- Total employee promoted from UCO is what percent more than total employee promoted from SBI?
- What is the percentage contribution of runs scored by Marcus Stoinis to the total runs scored by Glenn Maxwell and Steve Smith combined across all five mat...
- Study the following information and answer the following question. The number of units sold by a shop from Monday to Friday is given below: If Saturday...
- Find the average number of wallets sold by store B, C and D together on Tuesday.
- Ratio of price of Black pen and Red pen is 9:5 for shopkeeper A. Total amount received after selling both pens is Rs.800. Price of Red pens sold by D is 2/...
- If the total number of students in city C increases by 15% in the year 2018, what would be the total number of students in city C ?
- What is the ratio of the total number of lipstick sold by Maybelline to the total number of matte lipsticks sold by Colorbar?
- Number of wallets sold by A on Tuesday is what% of total number of wallet sold by the same store on all the days?
Hey! Ask a query
Please enter email id
The email must be a valid email address.
Please enter Mobile Number
Please enter valid Mobile Number
Please enter your Doubt
