


Question
The line graph given below shows the number of units of four different Coins sold. Read the graph carefully and answer the question that follows:
The line graph given below shows the number of units of four different Coins sold. Read the graph carefully and answer the question that follows:
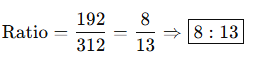
What is the ratio of total Gold and Bronze coins sold to Silver and Steel coins sold?

More Quant Miscellaneous Questions
- The monthly incomes of A and B are in the ratio of 5:6. A's monthly savings are 50% higher than B's monthly savings, while A's monthly expenditure equals B...
- If sin⁴ x + cos⁴ x = 5/8, then the value of sin2x is
- Find the simplified value of the expression: 32 + 12 x 108 ÷ 12 + 4 + 32 ÷ 16 x 3
- The derivative of y = eˣ · cos(x) is
- Which of the following option can be used to change page-size and margins?
- 2, 5, 16, 65, ?, 1957
- In the figure, ABCD is a cyclic quadrilateral with O as center of the circle If ∠ BOC = 136°, find ∠ OBC.
- 36×?² – (12×19+13) = 60% of 2400
- A trader buys a stock at an average price of Rs. 240 per share. He sells one-third of his shares at a 10% profit and the remaining at a 20% profit. What is...
- A person deposits ₹12,000 in a bank offering a 5% interest rate compounded annually. After 2 years, how much interest will he have earned?
Relevant for Exams:
Hey! Ask a query
Please enter email id
The email must be a valid email address.
Please enter Mobile Number
Please enter valid Mobile Number
Please enter your Doubt

Think You're Ready for RBI Grade B?
RBI Grade B 2026 Phase 1 Memory Based Paper
- 200 Questions with Detailed Solutions
- Section-wise Coverage (GA, English, Quant & Reasoning)