Question
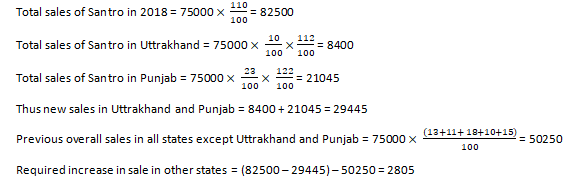
If in 2018, the total sales of Santro increased by 10% while its sales in Uttrakhand increased by 12% and that in Punjab increased by 22% then what is the increased in sales in the rest of the states?
Study the following bar graph and pie-chart and answer the questions given below: The bar graph shows the sales of six different brands of cars manufactures in 2017(in thousand) in India. The pie-chart shows the percentage sales of Santro in 2017 in different states of India.
More Di Bar Graph Questions
- The given bar chart presents the average marks obtained in English (E) and vernacular (V) by the students of five districts (D1, D2, D3, D4, D5) in a state...
- By what percent approximately should the sales of Nike be increased so that its sales volume in Delhi becomes 12000, while in all other cities remaining th...
- What is the ratio of water consumption per consumer in 2014 to the same in 2017?
- If in 2018, the total sales of Santro increased by 10% while its sales in Uttrakhand increased by 12% and that in Punjab increased by 22% then what is the ...
- The number of defective Cars manufactured by Honda Company is what percent of the number of defective Cars manufactured by Ford Company?
- The total sales of Fila, Adidas and Woodland in 2017 is approximately what percent of the total sales of Nike in all cities together in 2017?
- The given histogram represents the frequency distribution of average runs scored by 50 selected players from a district in a local cricket tournament. Ho...
- The given histogram represents the frequency distribution of average runs scored by 50 selected players from a district in a local cricket tournament. Wh...
- Out of the two bar graphs provided below, one shows the amounts (Rs in Lakhs) invested by a company in purchasing raw materials over the years and the othe...
- By what per cent should the sales of Santro be increased so that its sales volume in Maharashtra becomes 18000, while in all other states remaining the sam...
Hey! Ask a query
Please enter email id
The email must be a valid email address.
Please enter Mobile Number
Please enter valid Mobile Number
Please enter your Doubt
