Question
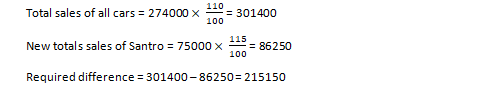
If total sales of cars of all brands together increases by 10% in 2018 and the the sales of Santro in Maharshtra increased by 15% keeping percentage distribution of Santro in these seven states the same as earlier, then what is the total sales of cars of all brands except Santro in 2018?
Study the following bar graph and pie-chart and answer the questions given below: The bar graph shows the sales of six different brands of cars manufactures in 2017(in thousand) in India. The pie-chart shows the percentage sales of Santro in 2017 in different states of India.
More Di Bar Graph Questions
- The total sales of Bolero, Tata Indica and Baleno together in 2017 is approximately what per cent of the total sales of Santro in all states together...
- The given histogram represents the frequency distribution of average runs scored by 50 selected players from a district in a local cricket tournament. Wh...
- Study the given graph and answer the question that follows. The total revenue in 2015 and 2017 is what per cent of the total expenditure of the co...
- The number of defective Cars manufactured by Honda Company is what percent of the number of defective Cars manufactured by Ford Company?
- By what per cent should the sales of Santro be increased so that its sales volume in Maharashtra becomes 18000, while in all other states remaining the sam...
- What is the ratio of female crew members working in Jet Airways to that in Air India?
- Total no of units in 2013 and 2015 are approximately what % more or less than Total units in 2014 & 2016 together?
- If total sales of cars of all brands together increases by 10% in 2018 and the the sales of Santro in Maharshtra increased by 15% keeping percentage distri...
- If in 2018, the total sales of Santro increased by 10% while its sales in Uttrakhand increased by 12% and that in Punjab increased by 22% then what is the ...
- If Worker E works alone for 15 days, how many units of the project will remain incomplete after this period?
Relevant for Exams:
Hey! Ask a query
Please enter email id
The email must be a valid email address.
Please enter Mobile Number
Please enter valid Mobile Number
Please enter your Doubt
