Question
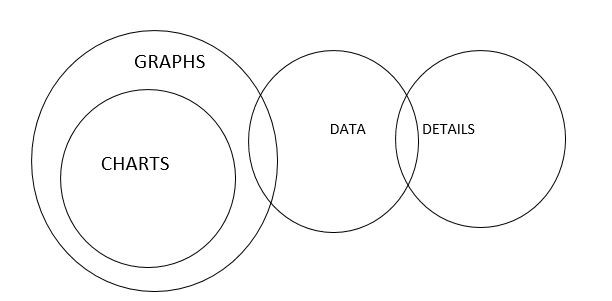
Statements: All charts are graphs. Some graphs are data. Some data are details. Conclusions:
Statements: All charts are graphs. Some graphs are data. Some data are details. Conclusions:
I. Some graphs are details.
II. Some charts are data.
III. Some data are not graphs.
In each of the questions below are given three statements followed by three conclusions numbered I, II and
III. You have to take the given statements to be true even if they seem to be at variance with commonly known facts. Read all the conclusions and then decide which of given conclusions logically follows from the given statements disregarding commonly known facts.
III. You have to take the given statements to be true even if they seem to be at variance with commonly known facts. Read all the conclusions and then decide which of given conclusions logically follows from the given statements disregarding commonly known facts.
More Syllogism Questions
- Read the given statements and conclusions carefully. Assuming that the information given in the statements is true, even if it appears to be at variance wi...
- Statements: Some digit are vowel. No vowel is letter. All letter are word. Conclusions: I. Some vowel are word. II. Some digit are word. III. Some word are...
- Statements: No Bed is Table No Table is Sofa All Sofa is Chair Some Chair is Almirah Conclusions: I. No Bed is Almirah II. Some Chair being Table is a ...
- Statements: Some villages are towns. Some towns are huts. All huts are rivers. Some rivers are tents. Conclusions: I. some tents are towns. II...
- In the question below there are three statements followed by two conclusions I and II. You have to take the three given statements to be true even if they ...
- Statements: Some Mountains are not Rivers. All Rivers are Hills. Only a few Hills are Oceans. Conclusions: I. Some River are Oceans. II. No River are Ocea...
- In the question below there are three statements followed by three conclusions I, II and III. You have to take the three given statements to be true even i...
- In the question below there are three statements followed by two conclusions I and II. You have to take the three given statements to be true even if they ...
- In the question below there are three statements followed by two conclusions I and II. You have to take the three given statements to be true even if they ...
- Statements:All Januarys are Februarys. No February is March. All marches are Aprils. Conclusions:I. some March are not Februarys. II. Some marche...
Relevant for Exams:
Hey! Ask a query
Please enter email id
The email must be a valid email address.
Please enter Mobile Number
Please enter valid Mobile Number
Please enter your Doubt
