Question
Find average number of boys in school – C, D and E.
Study the pie chart given below and answer the following questions. Pie charts shows the percentage distribution of total students in 5 different schools (A, B, C, D nad
E) and percentage distribution of total boys in these 5 schools in year 2019.
E) and percentage distribution of total boys in these 5 schools in year 2019.
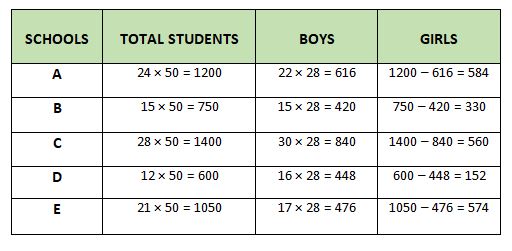 Required average = (1/3) × [(30+16+17)/100] × 2800 = 588
More DI Questions
- Find number of perfect diesel cars manufactured by Maruti Company?
- What is respective ratio of the number of males in Dehradun and females in Lucknow together to the number of males in Pune and females in Chandigarh togeth...
- D is another shopkeeper who sells wallets. The number of wallets sold by D is 16(2/3)% more than the average number of watches sold by B and C. Find the nu...
- What is the ratio of the number of bags sold by C to the number of watches sold by A?
- The question consists of two statements numbered “I and II” given below it. You have to decide whether the data provided in the statements are sufficient t...
- What is the average population (approximately) of cities C3, C5 and C7?
- Number of wallets sold by A on Tuesday is what% of total number of wallet sold by the same store on all the days?
- What is the difference between the number of all pizzas sold by Pizza Hut in the first week and the fourth week?
- If the shop sold 60% of the total number of pizzas baked by it on the day on which number of regular sized pizzas baked by it is maximum, then find the num...
- Worker A works alone for 6 days, then Worker B joins A for the next 4 days, and after that, Workers C, D, and E join them. How many units of work are compl...
Relevant for Exams:
Hey! Ask a query
Please enter email id
The email must be a valid email address.
Please enter Mobile Number
Please enter valid Mobile Number
Please enter your Doubt
