Question
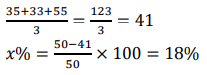
The given Bar Graph presents the number of different types of vehicles (in lakhs) exported by a company during 2014 and 2015. The average number of type A, B and D vehicles exported in 2015 was x% less than the number of type E vehicles exported in 2014. What is the value of x ?
More Bar graph Questions
- A regular hexagon has a side length of 10 units. Find the area of the hexagon.
- Question 2
- The number of students whose height is in the class interval 170-175 is what per cent less than the number of students whose height is in the interval 165-...
- Pawan and Qureshi jointly started a business with initial investments of Rs. 12,000 and Rs. 15,000, respectively. After one year, their profit shares are R...
- The no. of people prefer to go Singapore in 2012 is what percent fewer than the number of people preferring to go Singapore in 2013?
- Maya deposits Rs. 5,000 in a bank offering 10% p.a. simple interest. In how many months will her investment grow to Rs. 6,000?
- The average speed of a car traveling from city X to city Y is 60 km/h. On its return trip from city Y to city X, due to traffic, the car’s average speed dr...
- Find the ratio between the number of HP and Asus laptops sold in 2016 together and the number of Dell laptops sold in 2015 and 2017 together.
- What is the total number of applications received from the females in all the branches of the bank?
- Study the given table to answer the question that follows. The table shows the number of students who appeared in the 12th Board Examination from four sc...
Relevant for Exams:
Hey! Ask a query
Please enter email id
The email must be a valid email address.
Please enter Mobile Number
Please enter valid Mobile Number
Please enter your Doubt
