Question
Find average number of students participated in sports
A, B and D together in 2011. Read the information carefully and answer the following questions: The bar chart shows the number of students participated in four different sports event i.e. (A, B, C and D) in 2011 and 2012.Solution
Required average = (65 + 40 + 60)/3 = 55
More DI Questions
Find the missing term in the given series:
4 3.5 ? 22.875 ...
What number should replace the question mark?
Study the given pattern carefully and select the number that can replace the question mark (?) in it.
First row: 14, 12, 108
Second row:...
What will come in the place of question mark?
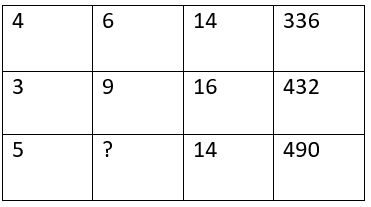
Find the missing number.
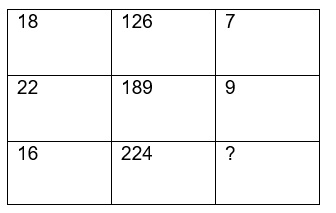
Find the missing number.
Find the missing number by analysing the pattern followed by the numbers in each row.
Find the missing term in the following question:
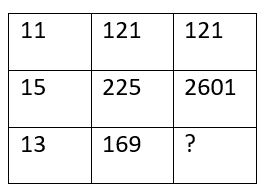
Find the missing number.
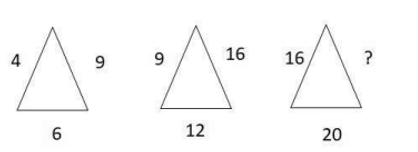
- What will come in the place of question mark?