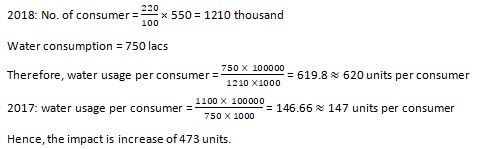
Question
If no of consumers in 2018 is 120% more than in 2013 while the consumption remain same as in 2017, then what will be the impact of no of units consumed by a consumer in 2018 when compared to water consumption per consumer in 2017?
The graph suggests the no. of consumers and usage of water of units in five years. Read the graph and answer the question. Total number of consumers are given in (thousand) and usage of water is given in (lacs).
More Di Bar Graph Questions
- What is the average number of female crew members working in all the airlines together?
- What is the difference between the sales of Nike in Chandigarh and that in Bhopal?
- Which companies manufactured the least number of defective cars in 2017?
- By what per cent should the sales of Santro be increased so that its sales volume in Maharashtra becomes 18000, while in all other states remaining the sam...
- What is the total number of male crew members working in all the airlines together?
- What is the different between the sales of Santro in Uttrakhand and that in Haryana?( in thousand units)
- The total sales of Bolero, Tata Indica and Baleno together in 2017 is approximately what per cent of the total sales of Santro in all states together in 2...
- What is the ratio of female crew members working in Jet Airways to that in Air India?
- The total number of total employees working in Emirates is approximately what percent more or less than that of Jet Airways?
- What was the respective ratio between the number of Petrol Perfect Cars manufactured by Honda Company and the number of defective Cars manufactured by Merc...
Hey! Ask a query
Please enter email id
The email must be a valid email address.
Please enter Mobile Number
Please enter valid Mobile Number
Please enter your Doubt
