Question
Number of girls in school B in 2020 are increased by 20% over previous year while number of boys are decreased by 14(2/7)%. Total students in school B in year 2020 are what percent more or less than the total students in school D in year 2019?
Study the pie chart given below and answer the following questions. Pie charts shows the percentage distribution of total students in 5 different schools (A, B, C, D nad
E) and percentage distribution of total boys in these 5 schools in year 2019.
E) and percentage distribution of total boys in these 5 schools in year 2019.
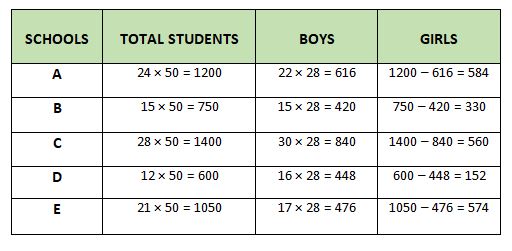 Total students in school B in year 2020 = (120/100) × 330 + (6/7) × 420 = 756 Required percentage = [(756 – 600)/600] × 100 = 26%
More DI Questions
- If the number of jackets produced by company E is twice the number of jackets produced by company C. The ratio of the number jackets and shirts produced by...
- Find the difference between the average number of yoga class students from institutes A, B and C and the average number of swimming class students from ins...
- If total female employee promoted from UCO are 66(2/3)% more than total male employee promoted from same bank, then find total employee promoted from BOB i...
- Find the approximate value of Question mark(?). No need to find the exact value. 11.92 × (63.94 ÷ 8.11) + 15% of 799.77 – √(35.86) = ?
- The HR division has 15% of the company’s workforce, distributed among Junior, Mid-Level, and Senior employees in the ratio 1:2:3. If each Junior employee c...
- What is the ratio of the number of Manual Cars sold by TATA to that by Honda?
- E spends 25% of his expenses on Travelling and he spend remaining expense amount on Household and Education. Expenses on Household are 550% more than that ...
- Read the table given below and answer the following question given below. Number of Students in Five Schools In which school is the percentage of girls ...
- ‘p’ is how much percent more than that of ‘t’?
- Workers C and D work together for 10 days. Calculate how many units they will complete in this period.
Relevant for Exams:
Hey! Ask a query
Please enter email id
The email must be a valid email address.
Please enter Mobile Number
Please enter valid Mobile Number
Please enter your Doubt
