Question
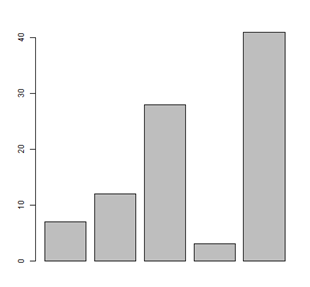
Basic syntax to create a bar-chart in R is
More IT Networking Questions
- SELECTGETDATE(); This query will give
- Token Ring networks operate at what speed?
- The network 198.78.41.0 is a
- Node.js is built on which JavaScript engine?
- Which database level is farthest to the users?
- C++ follows ___.
- In a depth-first traversal of a tree or graph, what data structure is typically used to keep track of nodes to be visited next?
- Which of the following techniques is used for dimensionality reduction while preserving the data’s variance?
- Which condition is shown in given picture?
- relation R(ABCD) has these dependencies {A → B, B → C,C → D} and it is decomposed into three relations R1(AB) , R2(BC), AND R3(CD). State true or false if ...
Hey! Ask a query
Please enter email id
The email must be a valid email address.
Please enter Mobile Number
Please enter valid Mobile Number
Please enter your Doubt
