Question
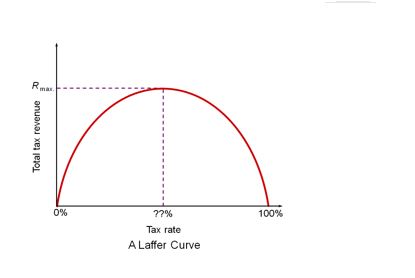
Which of the following statement is correct Statement 1: Laffer Curve shows relationship between tax rates and the amount of tax revenue collected by government Statement 2: At a 0% tax rate, collected tax revenue will be zero Statement 3: At a 100% tax rate, collected tax revenue will be maximum
More Research Questions
- According to the Capital Asset Pricing Model (CAPM), the relevant risk of a security is its:
- In a market economy
- Value Added Tax (VAT) is an example of:
- Which of the below probability distribution has same mean and variance?
- The wealth distribution in a certain country is described by following Lorenz Function F(x) = 3x6 where x lies between 0 and 1. What can yo...
- If the endowment of some resource increases, the industry that uses that resource most intensively will increase its output while the other industry will d...
- Which of the following is NOT a postulate of the Classical Model of full-employment equilibrium?
- Comparative statics in mathematics/economics refers to:
- If following is a payoff (profit) matrix for Firm A and B. What should be strategy for Firm A. first number is for Firm A and second is for Firm B.
- Endogenity is associated with which of the following ?
Hey! Ask a query
Please enter email id
The email must be a valid email address.
Please enter Mobile Number
Please enter valid Mobile Number
Please enter your Doubt
